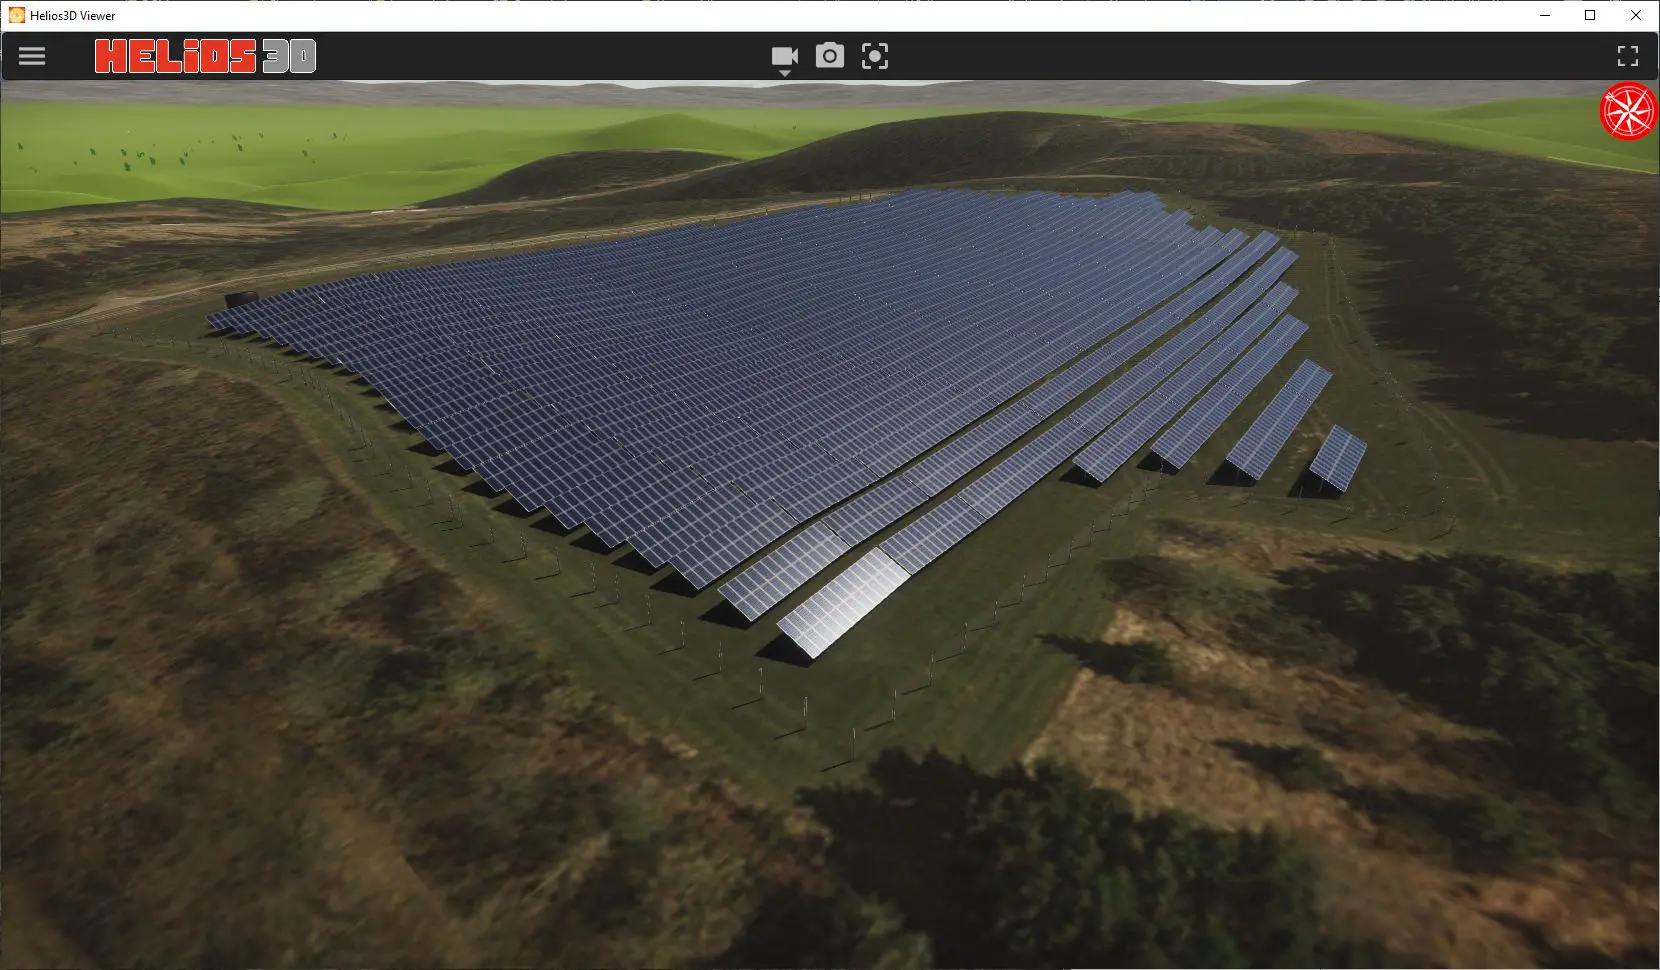
- Height Shading: Illustrates terrain structure with shading, reflecting different vegetation or regions.
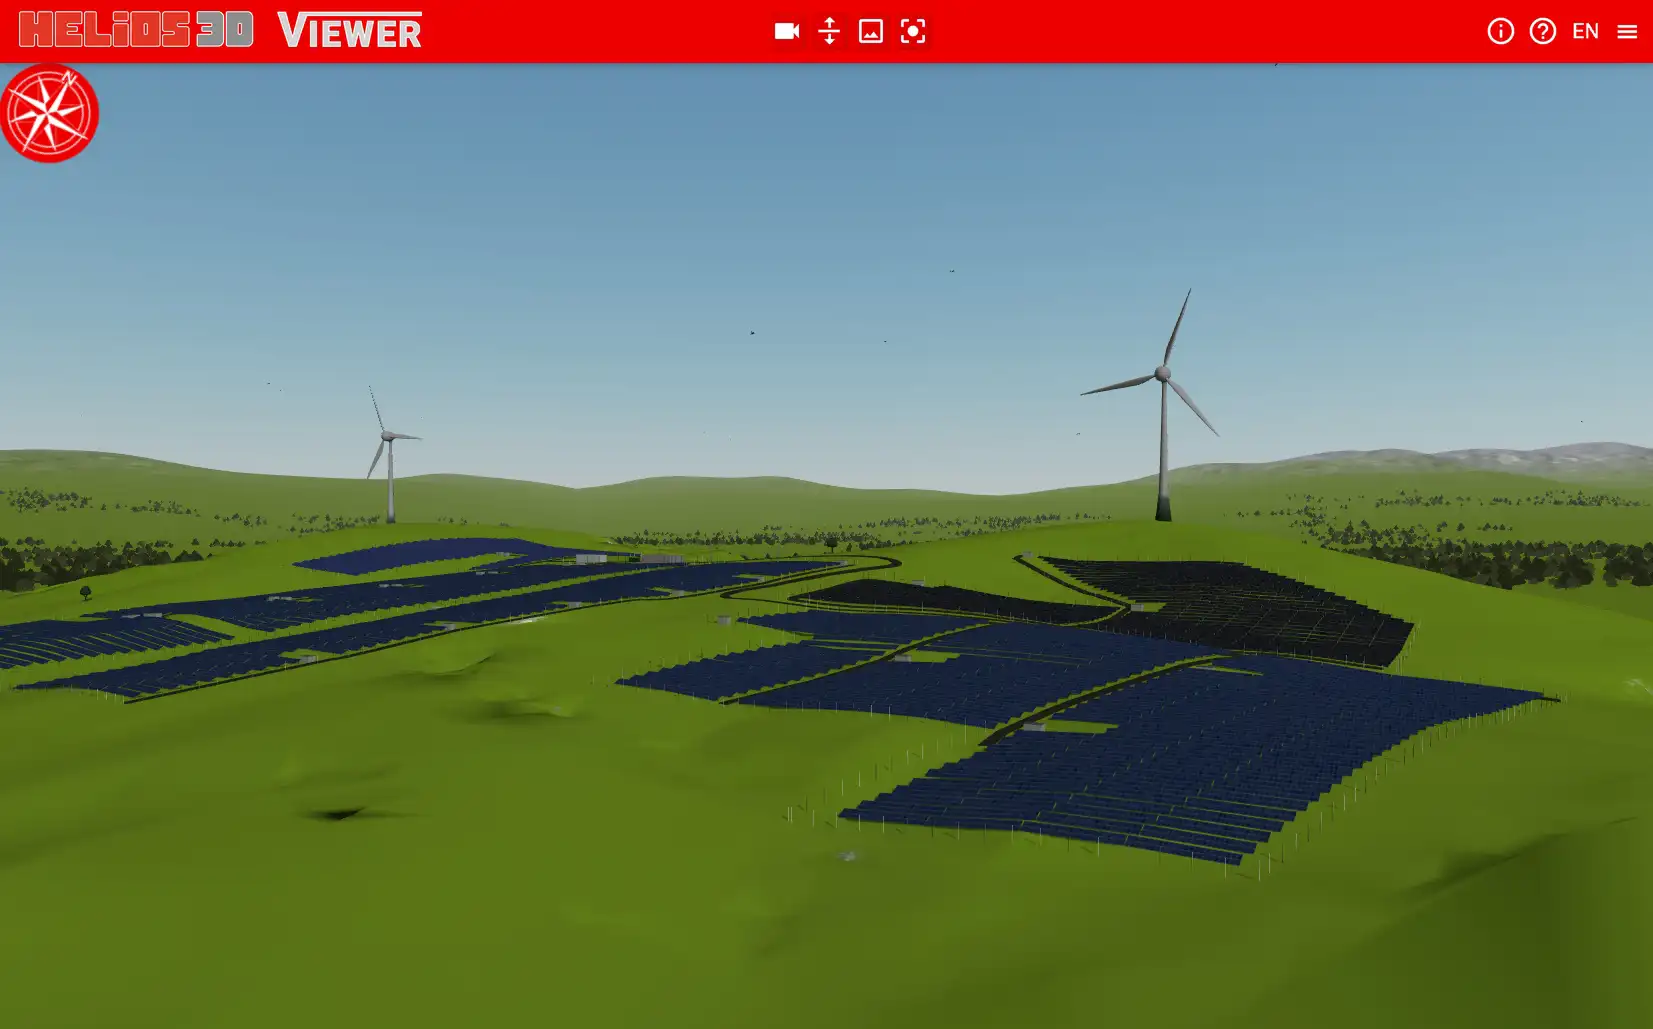
- High-Resolution Screenshots: Capture up to 8K resolution images from the viewer, including company or project logos and data.
- Waterdrop Analysis: Demonstrates potential waterflow and erosion post-grading.
- Shading Visualization: Shows shadow patterns at various times and days for layout optimization.
- Shading Heatmap: Provides a summary heatmap for each period to identify heavy shading areas.
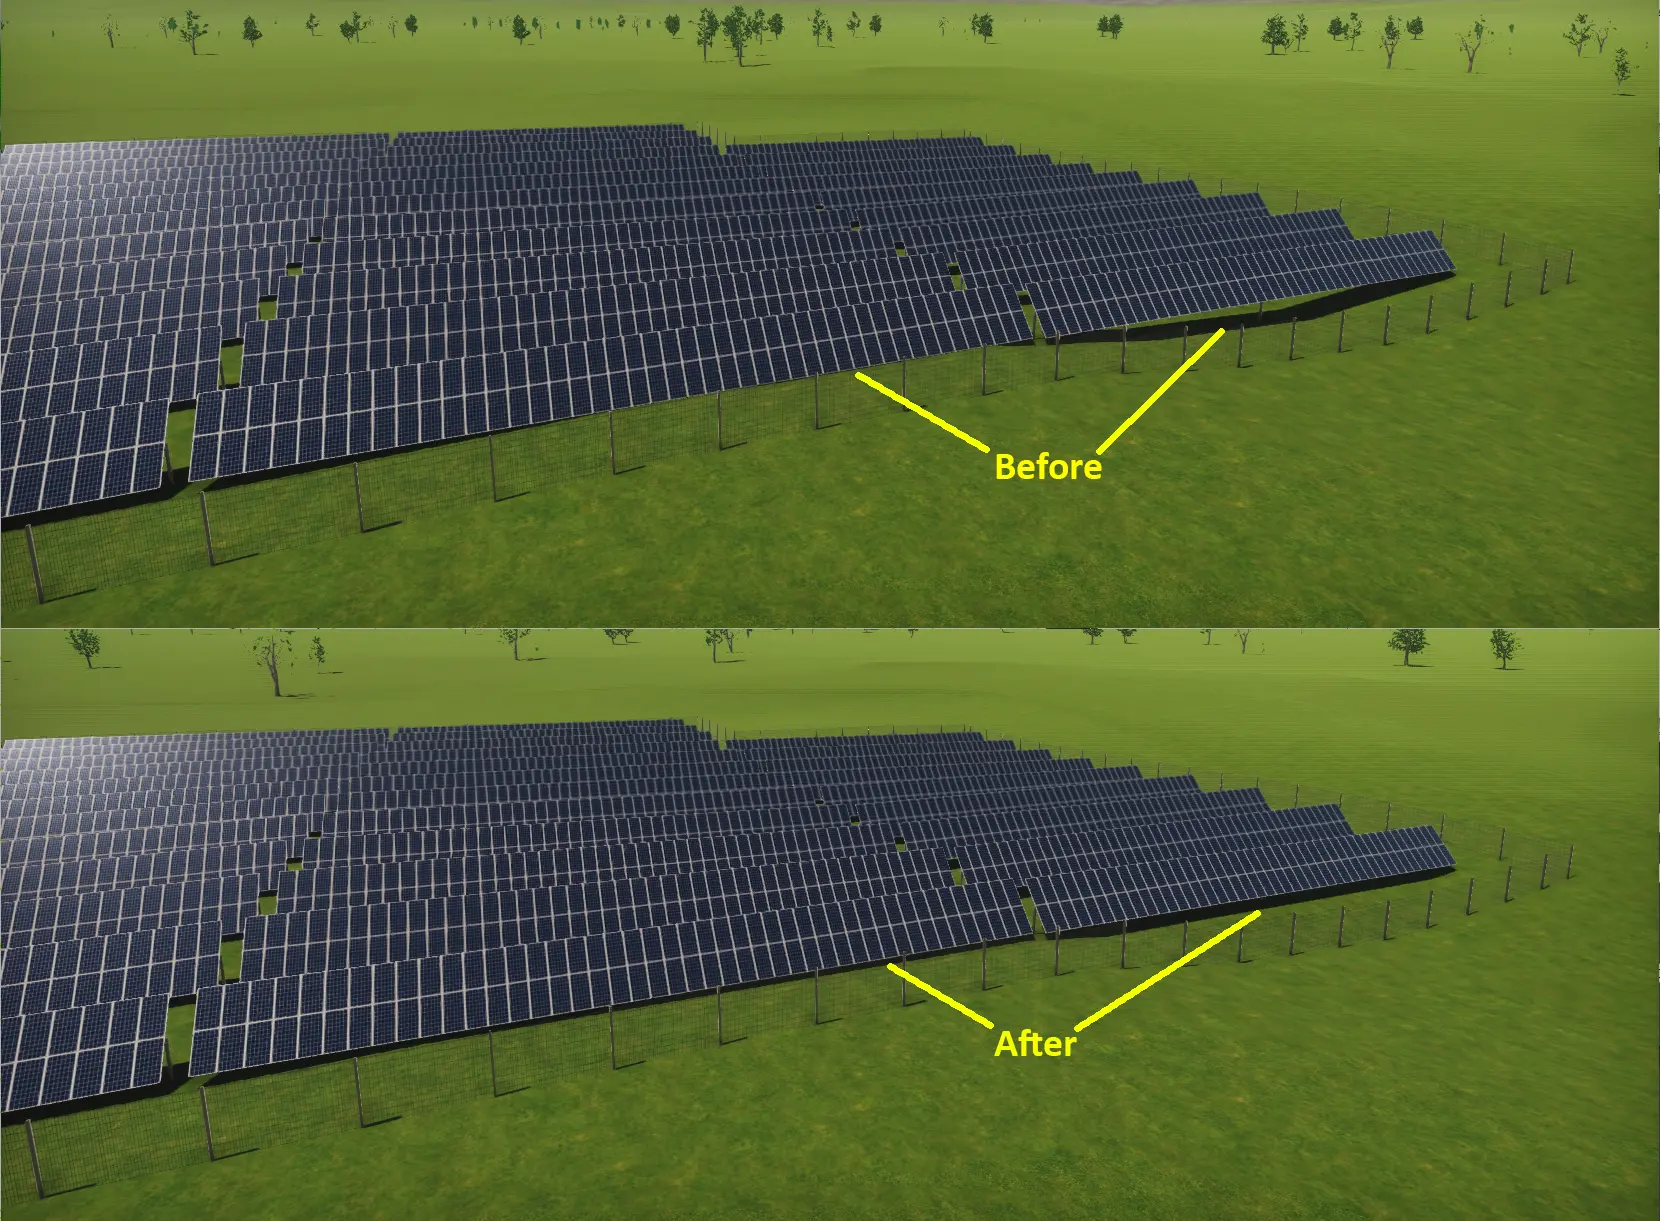
- Yield Analysis and Cable Loss Visualization: Displays the impact of shading on yield production and cable losses with color mapping.